BOOK 18/25Reports & audits
Reports
Read detailed sales reports across 7 sections, pick from several date-range presets, export straight to CSV, and check kitchen/bar operational performance on a separate tab.
Sales report
Pick a time range
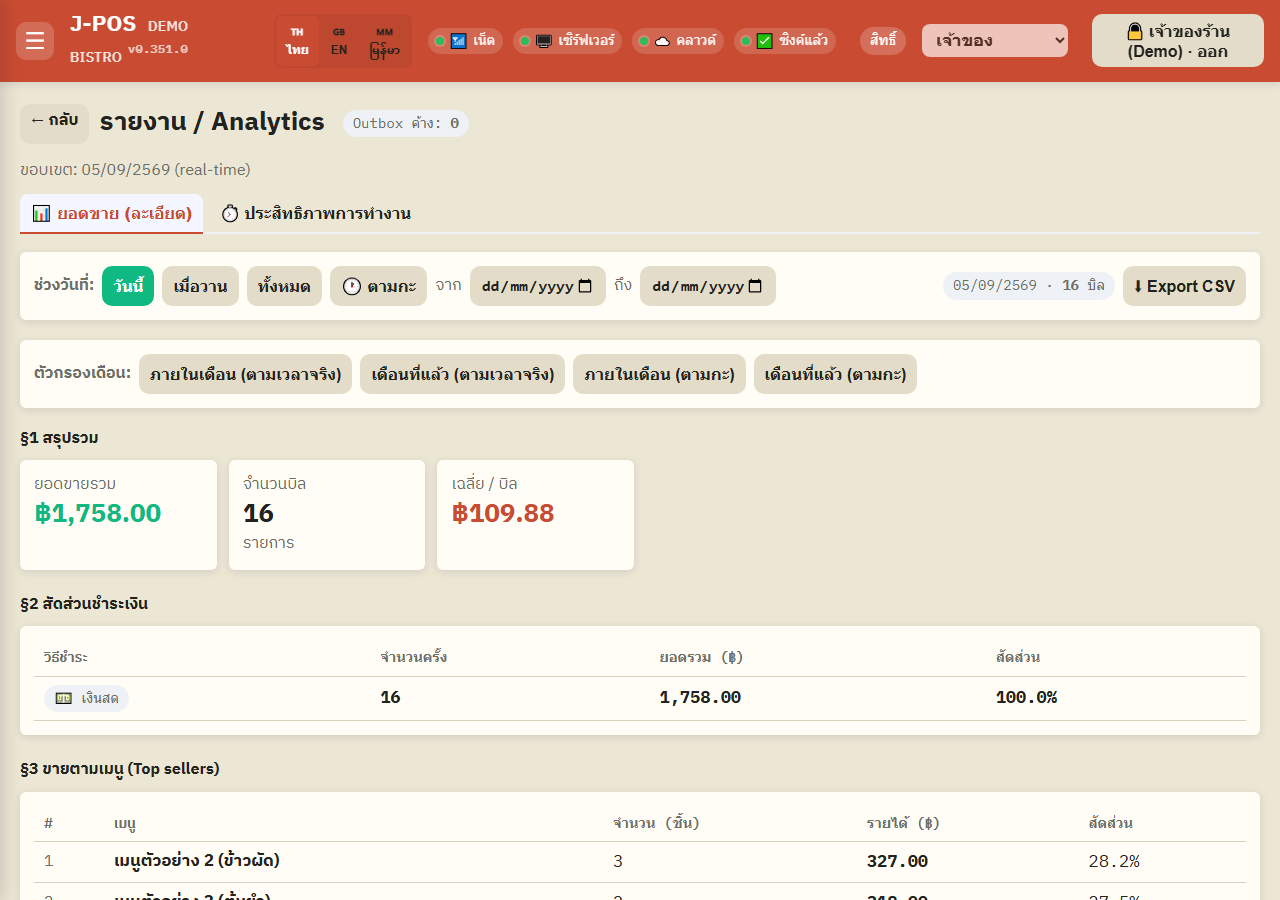
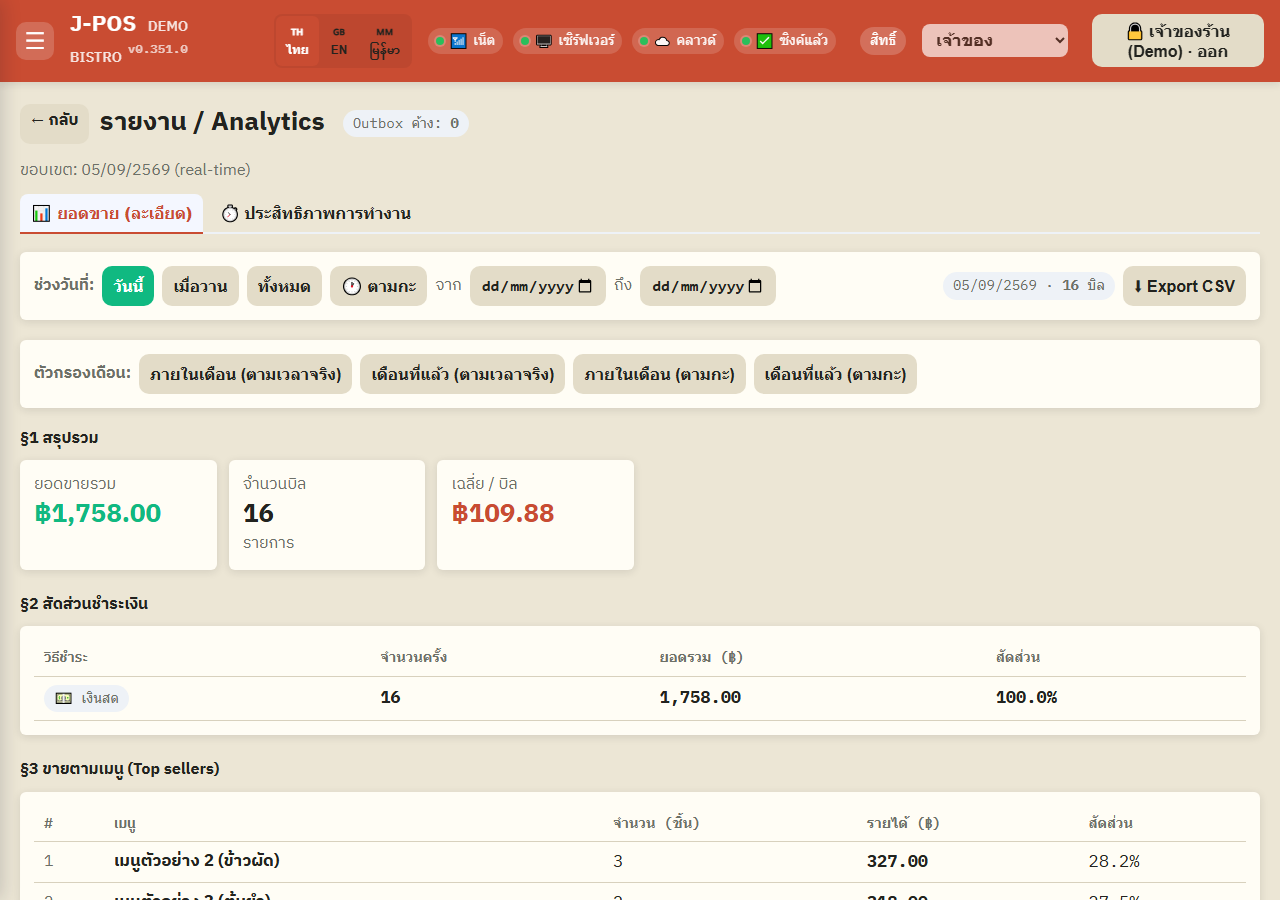
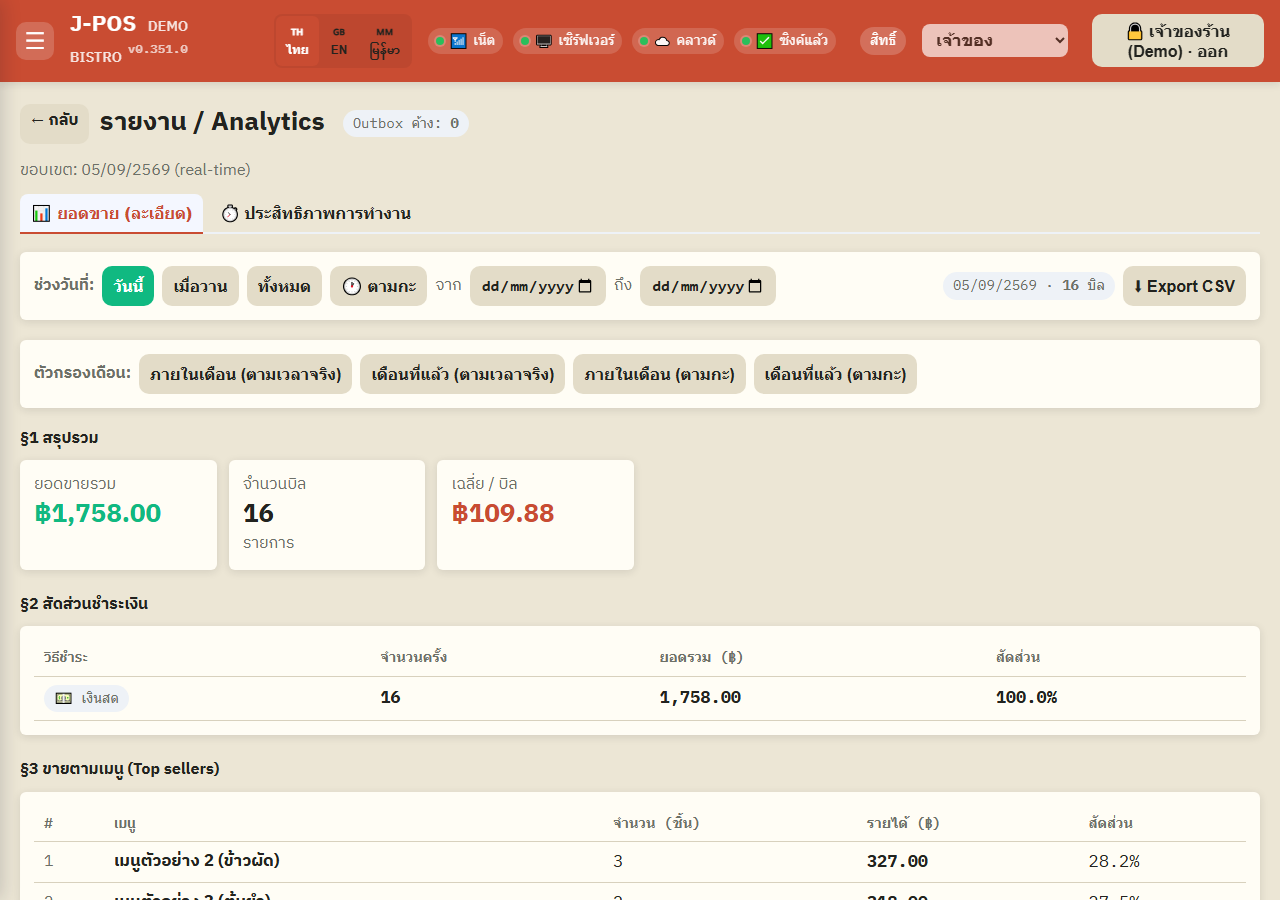
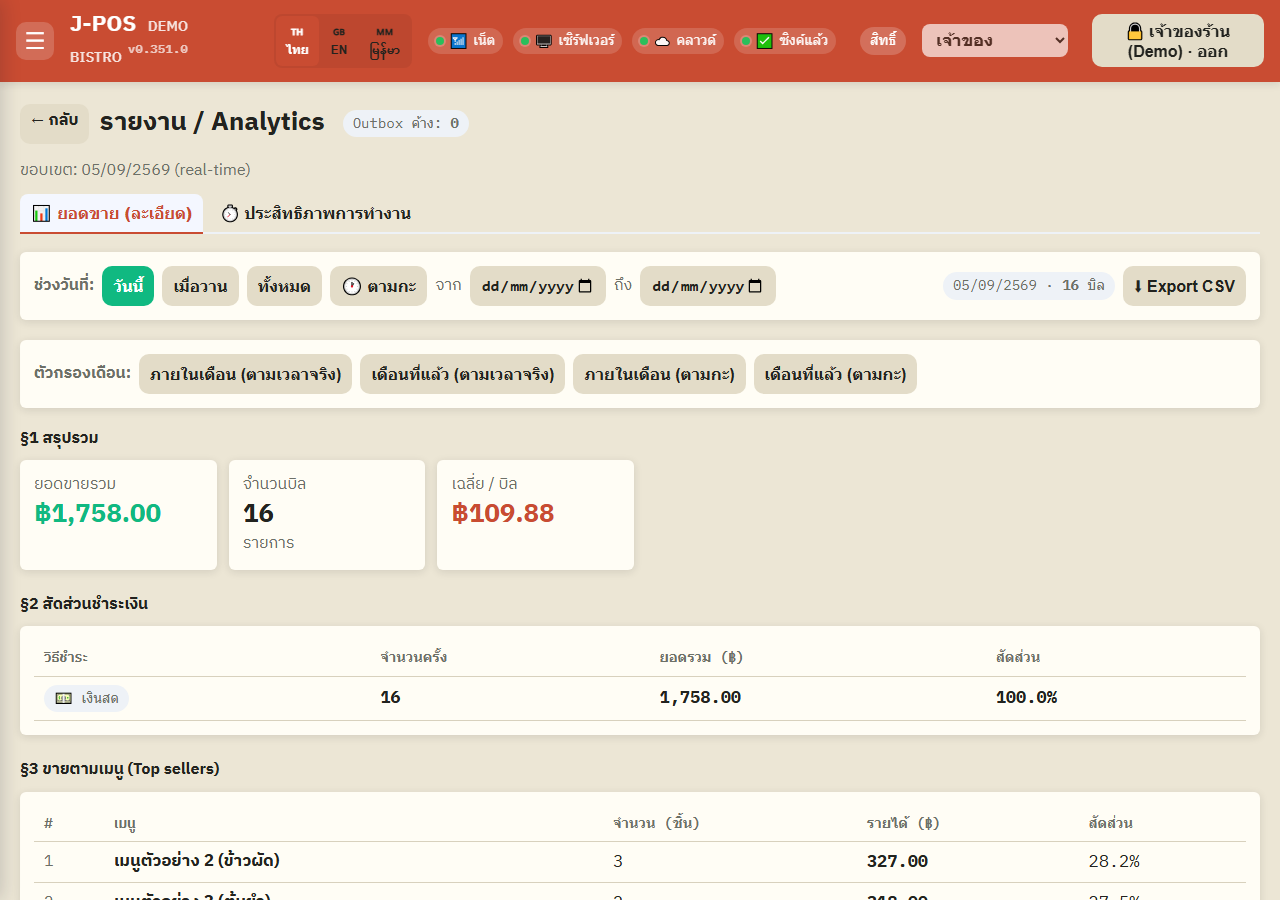
Choose from several presets: today, yesterday, a custom “from...to...” date range, this month, last month, or a single specific shift that was already opened and closed.
Every number on the page recalculates instantly for whatever range you pick, with a badge showing that range's bill count.
Open full size Read the summary and payment-method split
§1 Summary shows total revenue, bill count, and average per bill for the selected range.
§2 Payment split breaks revenue down by channel — cash, PromptPay (further split by sub-channel, e.g. SCB Mae Manee, KPlus Shop), and card (EDC).
Open full size See top-selling items, categories, and groups
§3 Top sellers ranks the best-selling menu items.
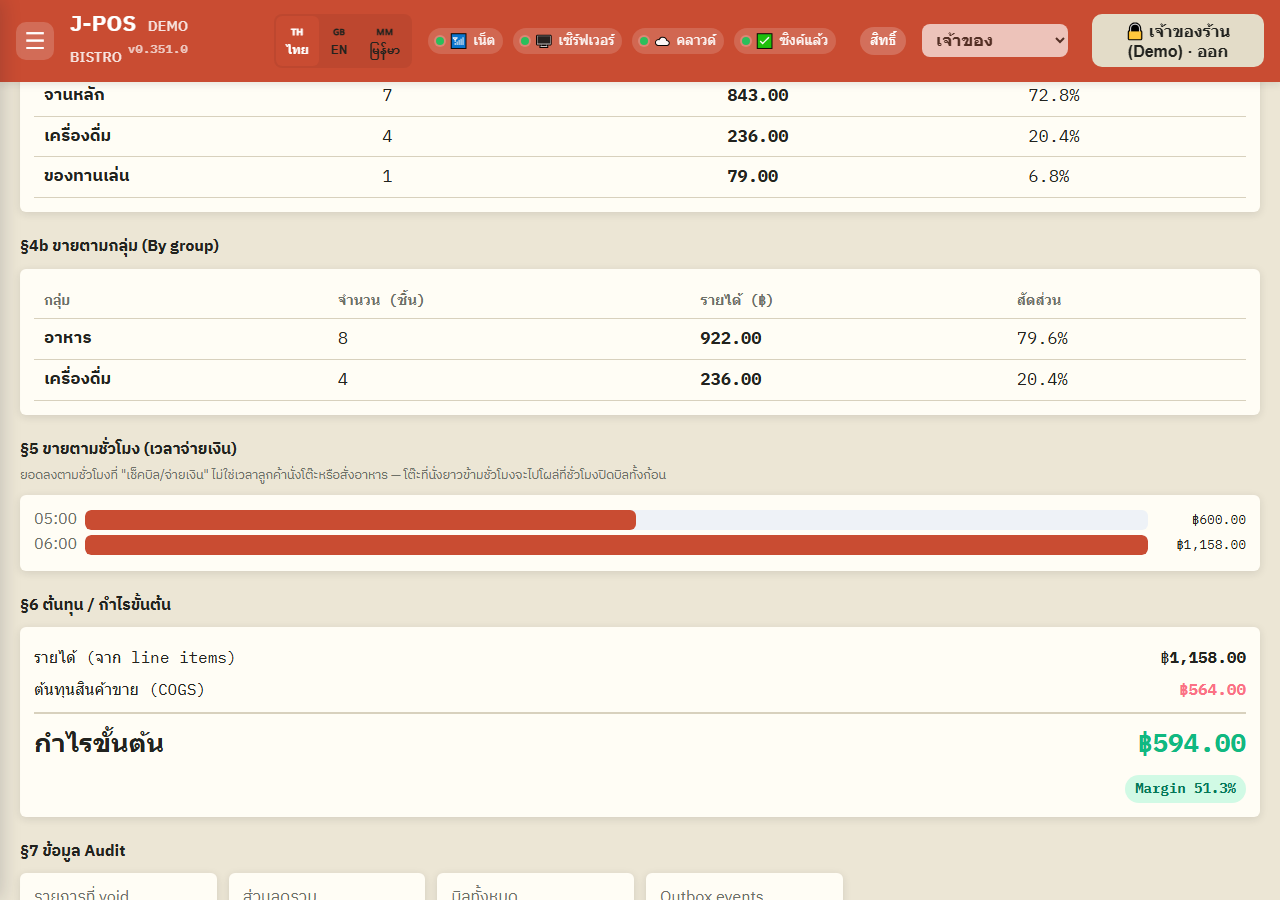
§4 By category and §4b By group roll revenue up into the categories and menu groups configured in the system — faster to scan than going item by item.
Open full size See the busiest hours of the day
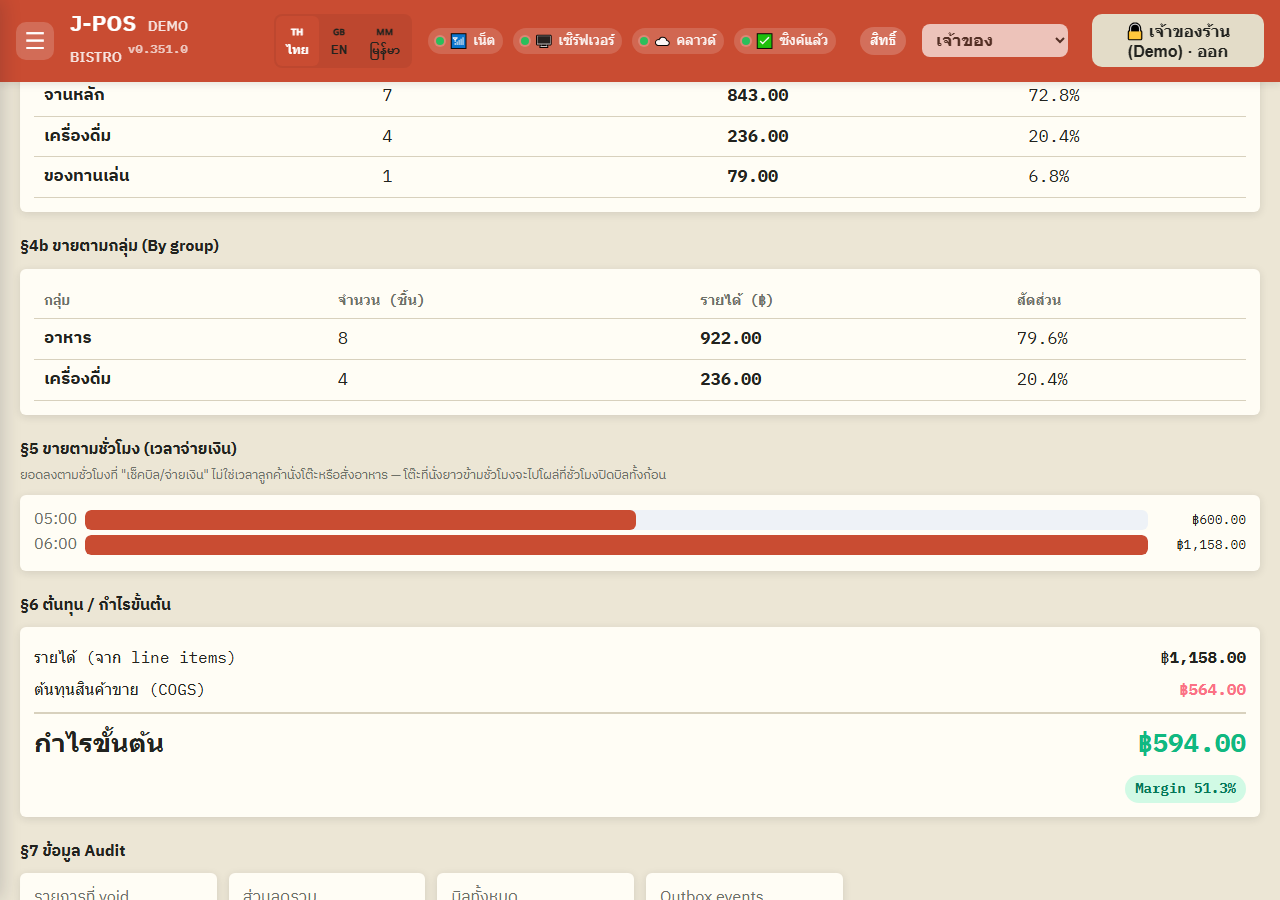
§5 By hour breaks revenue down hour by hour (based on the actual payment time), useful for staffing or prep planning around peak hours.
Open full size Check cost and gross margin
§6 Cost / gross margin compares revenue against ingredient cost (COGS) to show gross profit and margin percentage — it needs menu recipes and ingredient costs entered first for the figures to be complete. Staff without cost-view permission see the note “🔒 ตัวเลขต้นทุน / กำไรขั้นต้น ต้องมีสิทธิ์ดูต้นทุน (cost.view)” (cost / gross-margin figures need cost-view permission) instead of the numbers.
Open full size Review audit data
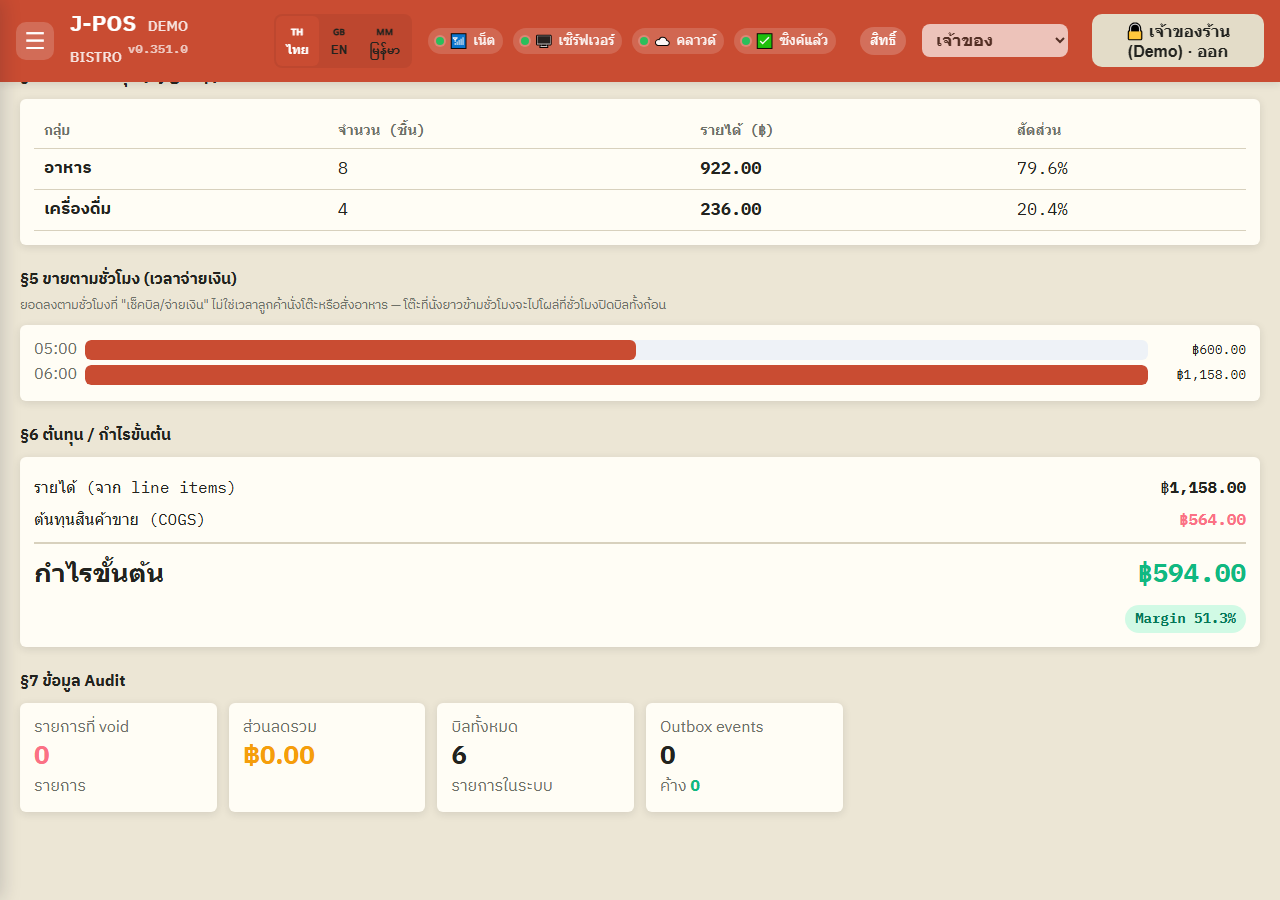
§7 Audit data summarizes what's worth watching in that range, such as how many items were voided and the total discount given.
Open full size Export to CSV
Press “⬇ Export CSV” to download every section (§1-§7) for the range currently on screen as a single file, ready to open in Excel (Thai text included correctly). Without cost-view permission, §6 in the file is a single line saying it isn't shown.
Open full size
Operational performance report
Check average order-fulfillment time
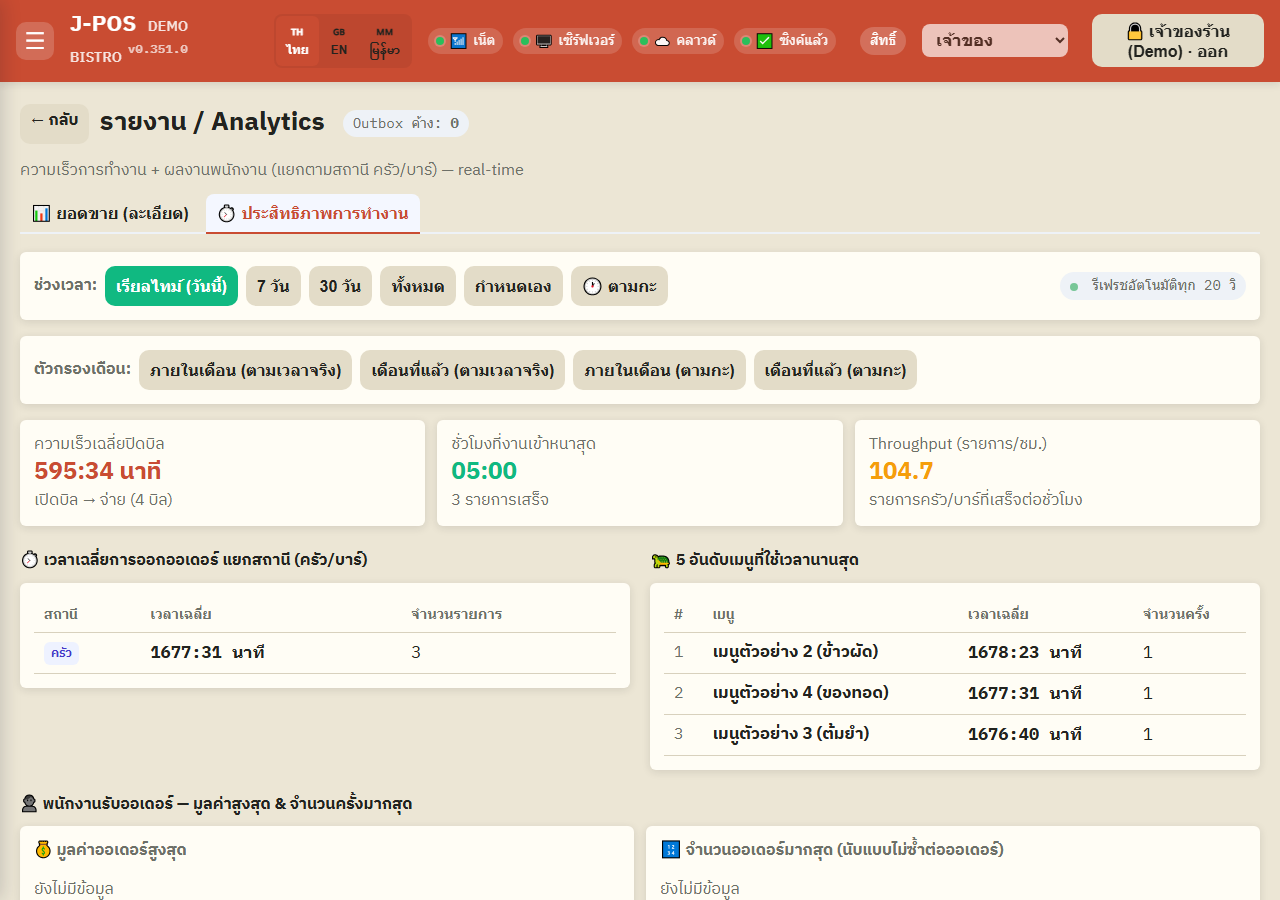
Switch to the “⏱️ Performance” tab to see the average time from order to completion, broken down by station (kitchen/bar) — useful for spotting which station is running slower than usual. This tab requires the financial-reports permission to open.
Open full size
Common points of confusion
§6 Cost / gross margin needs recipes and ingredient costs
§6 cost is worked out from menu recipes × ingredient costs, so the figures are incomplete until those are entered. The section is hidden from staff without the cost-view permission (cost.view): the screen shows a note instead of the numbers, and the CSV leaves out the §6 figures too — read these figures from an account that has cost-view permission.
CSV export only covers whatever range is on screen right now
The Export CSV button pulls the numbers for the range currently selected at the moment you click — to get several ranges, change the filter and export again each time.
The Performance tab needs its own permission, separate from the sales tab
Being able to open the reports page doesn't automatically mean you'll see the “Performance” tab — that tab specifically requires the financial-reports permission, and shows an access-denied message without it.